
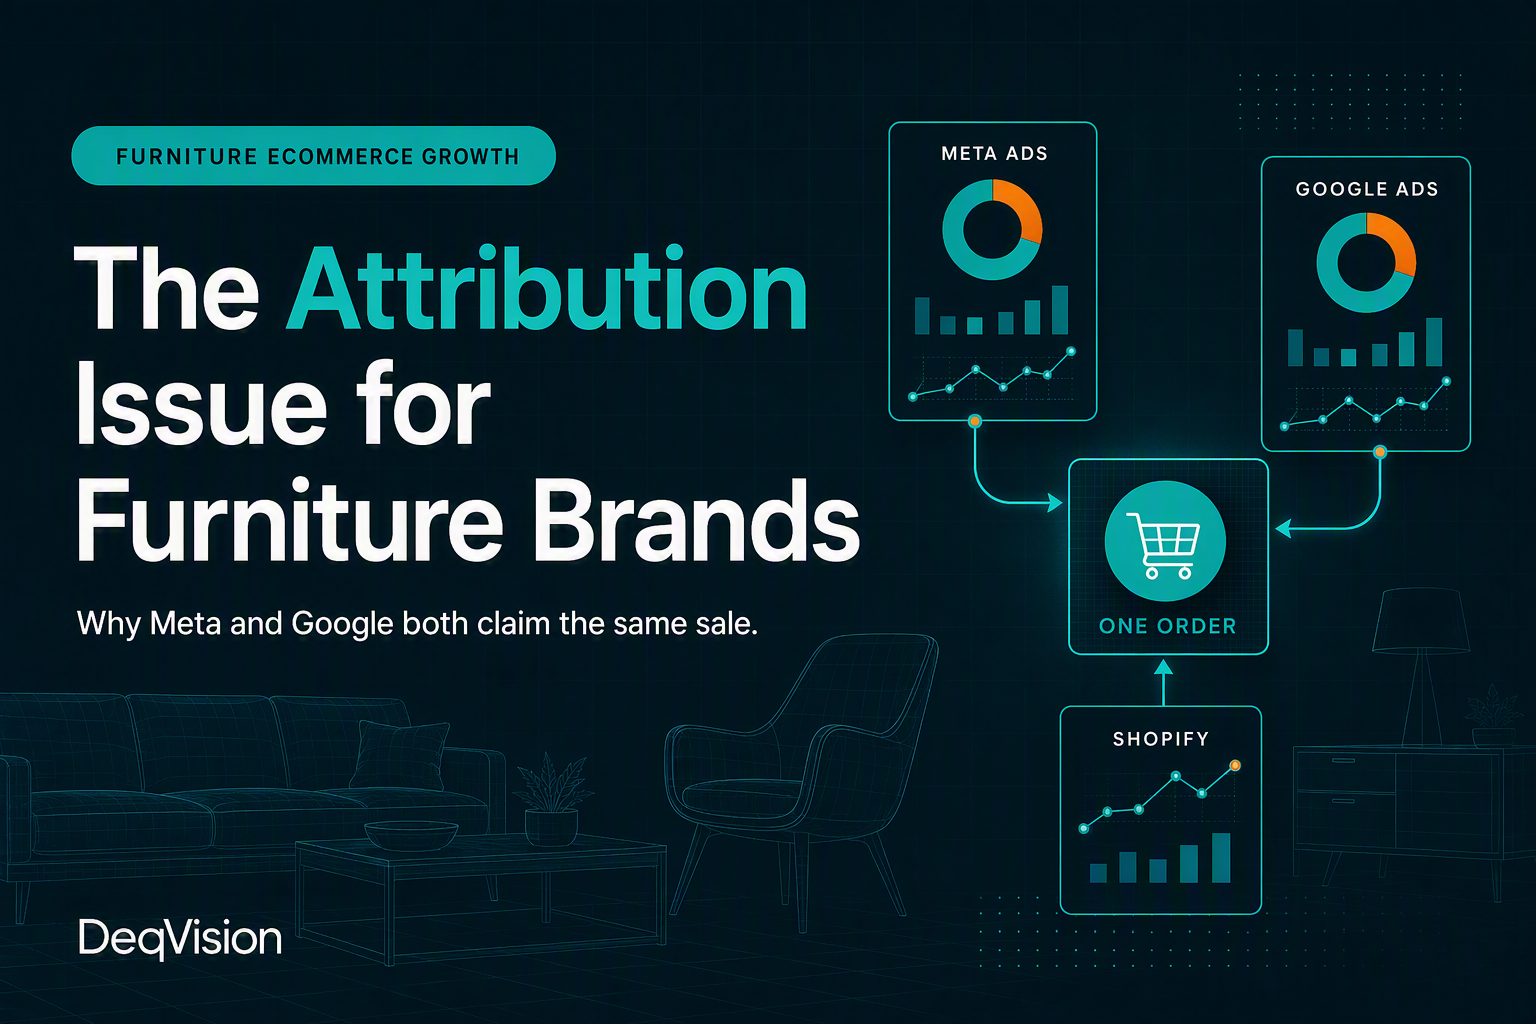
Once a furniture brand runs Meta and Google at the same time, both platforms start claiming the same orders. That can make a weak campaign look strong, a strong campaign look weak, and your next budget decision completely wrong.
The short answer: do not add the revenue reported by Meta, Google Ads and Google Analytics together. They are different views of the same customer journey, not separate piles of sales. For furniture brands spending £10K+ a month, the number that matters is blended store performance, not the ROAS inside one platform.
Furniture is a considered purchase. Buyers often see an ad, compare options, return through search, then buy later.
What attribution looks like when your spend increases
At £2K per month, you can get away with a simple view. You may be running one channel, one main campaign, and a small number of products. At £10K+ per month, that stops working.
You are likely running Meta for discovery and retargeting, Google Shopping or Performance Max for high-intent searches, branded search to protect demand, and email to bring shoppers back. A buyer can touch all of these before ordering a £1,200 sofa.
Each platform wants to show that it caused the sale. Meta sees an ad view or click and takes credit. Google sees a product search or brand search and takes credit. Email sees the last click and takes credit. The result is simple: reported revenue across channels is higher than the revenue that actually hit your Shopify store.
A shopper sees a Meta video of your dining table on Monday. They visit but do not buy. On Thursday, they search your brand on Google, compare finishes, then return via an abandoned-cart email on Sunday. Meta, Google and email may all claim the same order.
Why Meta and Google both overclaim sales
Overattribution is not always a tracking error. It is built into how advertising platforms report results. They each use their own attribution window, tracking rules and view of the customer journey.
| Channel | What it can see | How it can mislead you |
|---|---|---|
| Meta Ads | Ad views, clicks and later purchases inside its selected window. | Can claim purchases where Meta created awareness but did not close the order. |
| Google Ads | Searches, Shopping clicks and branded searches close to purchase. | Can claim orders that were first created by Meta demand. |
| The last email click before checkout. | Often gets credit for a buyer who was already convinced by paid media. | |
| Google Analytics | Sessions and tracked source paths under its own rules. | Misses part of the journey when users reject cookies, switch device or return through an untracked route. |
This does not mean Meta, Google or email are lying. It means no single platform has the complete picture.
Why Google Analytics is not enough for furniture brands
Google Analytics is useful for checking broad traffic and conversion trends. It is not reliable enough to be your only decision tool once you have multiple paid channels and a longer buying cycle.
Furniture buyers do not behave in a clean, one-session path. They research on a work laptop, open product pages on their phone, ask a partner, visit again through branded search, and order days or weeks later. Google Analytics can only report what it can identify under its tracking rules.
- Consent mode creates gaps. Some visitors do not accept cookies, so their full path is not visible.
- Devices break the journey. A Meta click on mobile and a purchase on desktop may not join up.
- Last-click views reward the closer. They do not show the channel that created the demand in the first place.
- Channel labels simplify reality. A sale gets placed in one bucket even when several channels influenced it.
Use Google Analytics for direction, not verdicts. If Google Analytics says a channel is weak while store revenue, new customer growth and blended return are improving, do not pause that channel based on one report.
Why we do not make decisions from first-click or last-click attribution
First-click and last-click attribution are both too narrow for a furniture brand trying to reach £1M per month.
| Model | What it rewards | Why it fails for furniture |
|---|---|---|
| First click | The channel that introduced the brand. | Gives too much credit to discovery and ignores the work needed to turn interest into an order. |
| Last click | The final channel before purchase. | Gives too much credit to branded search, email and retargeting while undervaluing demand creation. |
| Blended view | Store revenue, spend, margin and customer growth across all channels. | Best starting point for making budget decisions at scale. |
A brand that only uses last-click data will usually keep feeding branded search and retargeting because they look efficient. Then it cuts Meta prospecting, video and creative testing because they look expensive. A few weeks later, branded search and retargeting weaken too, because there is less new demand entering the system.
What to measure instead
For a furniture brand spending more than £10K per month, the goal is not to find a perfect attribution number. It does not exist. The goal is to make decisions using a scorecard that is close enough to the truth to protect profitable growth.
Start with store revenue and contribution margin
Your ecommerce platform and finance data are the anchor. Look at total revenue, gross margin, shipping cost, discounting, returns and marketing spend together. A 5x platform ROAS is not useful if it is creating unprofitable orders.
Track blended MER and CAC
Blended MER is total store revenue divided by total marketing spend. Blended CAC is total marketing spend divided by new customers. These numbers stop one channel from taking credit for the whole business.
Use Triple Whale to connect the signals
Tools such as Triple Whale bring paid media, Shopify and customer data into one view. They are useful because they reduce the need to jump between platform dashboards. They are not a magic source of truth, so treat their data as a decision aid, not absolute fact.
Run controlled budget tests
Change one meaningful variable at a time. For example, increase Meta prospecting spend for two to three weeks while holding other major activity stable. Watch total revenue, blended MER, new customer share and branded search demand. That tells you more than a single attribution report.
A practical attribution framework for furniture brands
Use this before increasing spend, cutting a channel or declaring a campaign a winner.
- Daily: Watch spend pacing, site revenue, checkout health and major tracking breaks.
- Weekly: Review blended MER, blended CAC, revenue by product category, new versus returning customers, and the direction of branded search.
- Monthly: Compare channel spend changes against total revenue, contribution margin and customer growth. Ask what would have happened if the channel had not run.
- Every quarter: Review your attribution windows, reporting setup and measurement plan before scaling budgets again.
Never scale or cut a major channel because one dashboard says so. Check the result against Shopify revenue, margin, customer acquisition cost and the wider channel mix first.
Frequently asked questions
Why do Meta Ads and Google Ads both claim the same furniture sale?
They use different rules and attribution windows. A buyer may discover a product through Meta, search on Google later and then buy. Both platforms can report the same order as a conversion.
Can Google Analytics show the true source of every furniture sale?
No. It is useful for trend analysis, but it cannot fully capture a long journey across devices, browsers and consent choices. It should not be the only report you use to move budget.
Is Triple Whale accurate enough to use for budget decisions?
It is useful for bringing store and media data into one view. Use it alongside Shopify revenue, margin and controlled testing. No attribution tool can tell you the full truth on its own.
What is the best attribution model for a furniture brand?
There is no single perfect model. Use a blended view of total revenue, total marketing spend, margin, new customers and channel tests. Do not rely on first-click or last-click alone.
Not sure which channel is actually driving growth?
We help furniture brands spending £10K+ per month build a reporting system that supports better budget decisions, not prettier dashboards.
Book a growth call